Case Study
Detectors
Automate utility usage abnormality and fault detection for large corporate real estate buildings.
Time Frame: 2 Months
Key Skills: User Research, stakeholder collaboration, defining pain points, user flows, wireframes, high fidelity mockups, prototyping, user testing
Team: 1 Designer (me), Product Manager, Dev Team
Step 1
Research

I use this system to continue honing in on our product needs, focusing more on discussions with product managers and developers, so we can ensure our business and product needs are also highlighted and extrapolated.
At this point, we established that for this project, we should attempt a solid step towards our ultimate goal of automating this building issue detection process. We needed to iterate towards that while taking into consideration what we could feasibly do in a reasonable time frame with our allocated development resources.


After understanding the issue more clearly, I dug into some competitive research to understand the market as it stands. What exists? What doesn’t work? What do we need to avoid?
With a pretty open prompt, I wanted to really hone in on what we currently had in the application and how our customers were solving the problem, along with understanding the intricacies of this issue myself. I did this by creating a user flow after doing many interviews with our internal experts (4 people, 8 interviews) along with external customers (7 interviews focusing on our engineering users, as they were the primary target)
Step 2
Exploration
Once I had a pretty good lay of the land, I begun iterating on a new potential user flow for this project. What would be the optimal path for our customers? This allowed me to take a high level view of the project, avoiding getting too into the nitty gritty while we are exploring options. This also created an asset that I was able to discuss with developers, is this even doable? What problems do we for-see with development of this project? What should we do to avoid those problems?

I begun wire-framing out the flow as a whole to understand the project more in depth. I unfortunately lost some of the assets related to this step, but the image above represents one of the 6 pages created for this.

Step 4
User Test
Once we had the wireframes put together, I completed another user test to review our solutions. For this, I interviewed 10 customers with different size buildings, different HVAC setups, and different expertise levels to get a good variety of input.
I organized those findings in a few different ways, below are some screenshots from the document I put together afterwords.


Step 5
Prototype
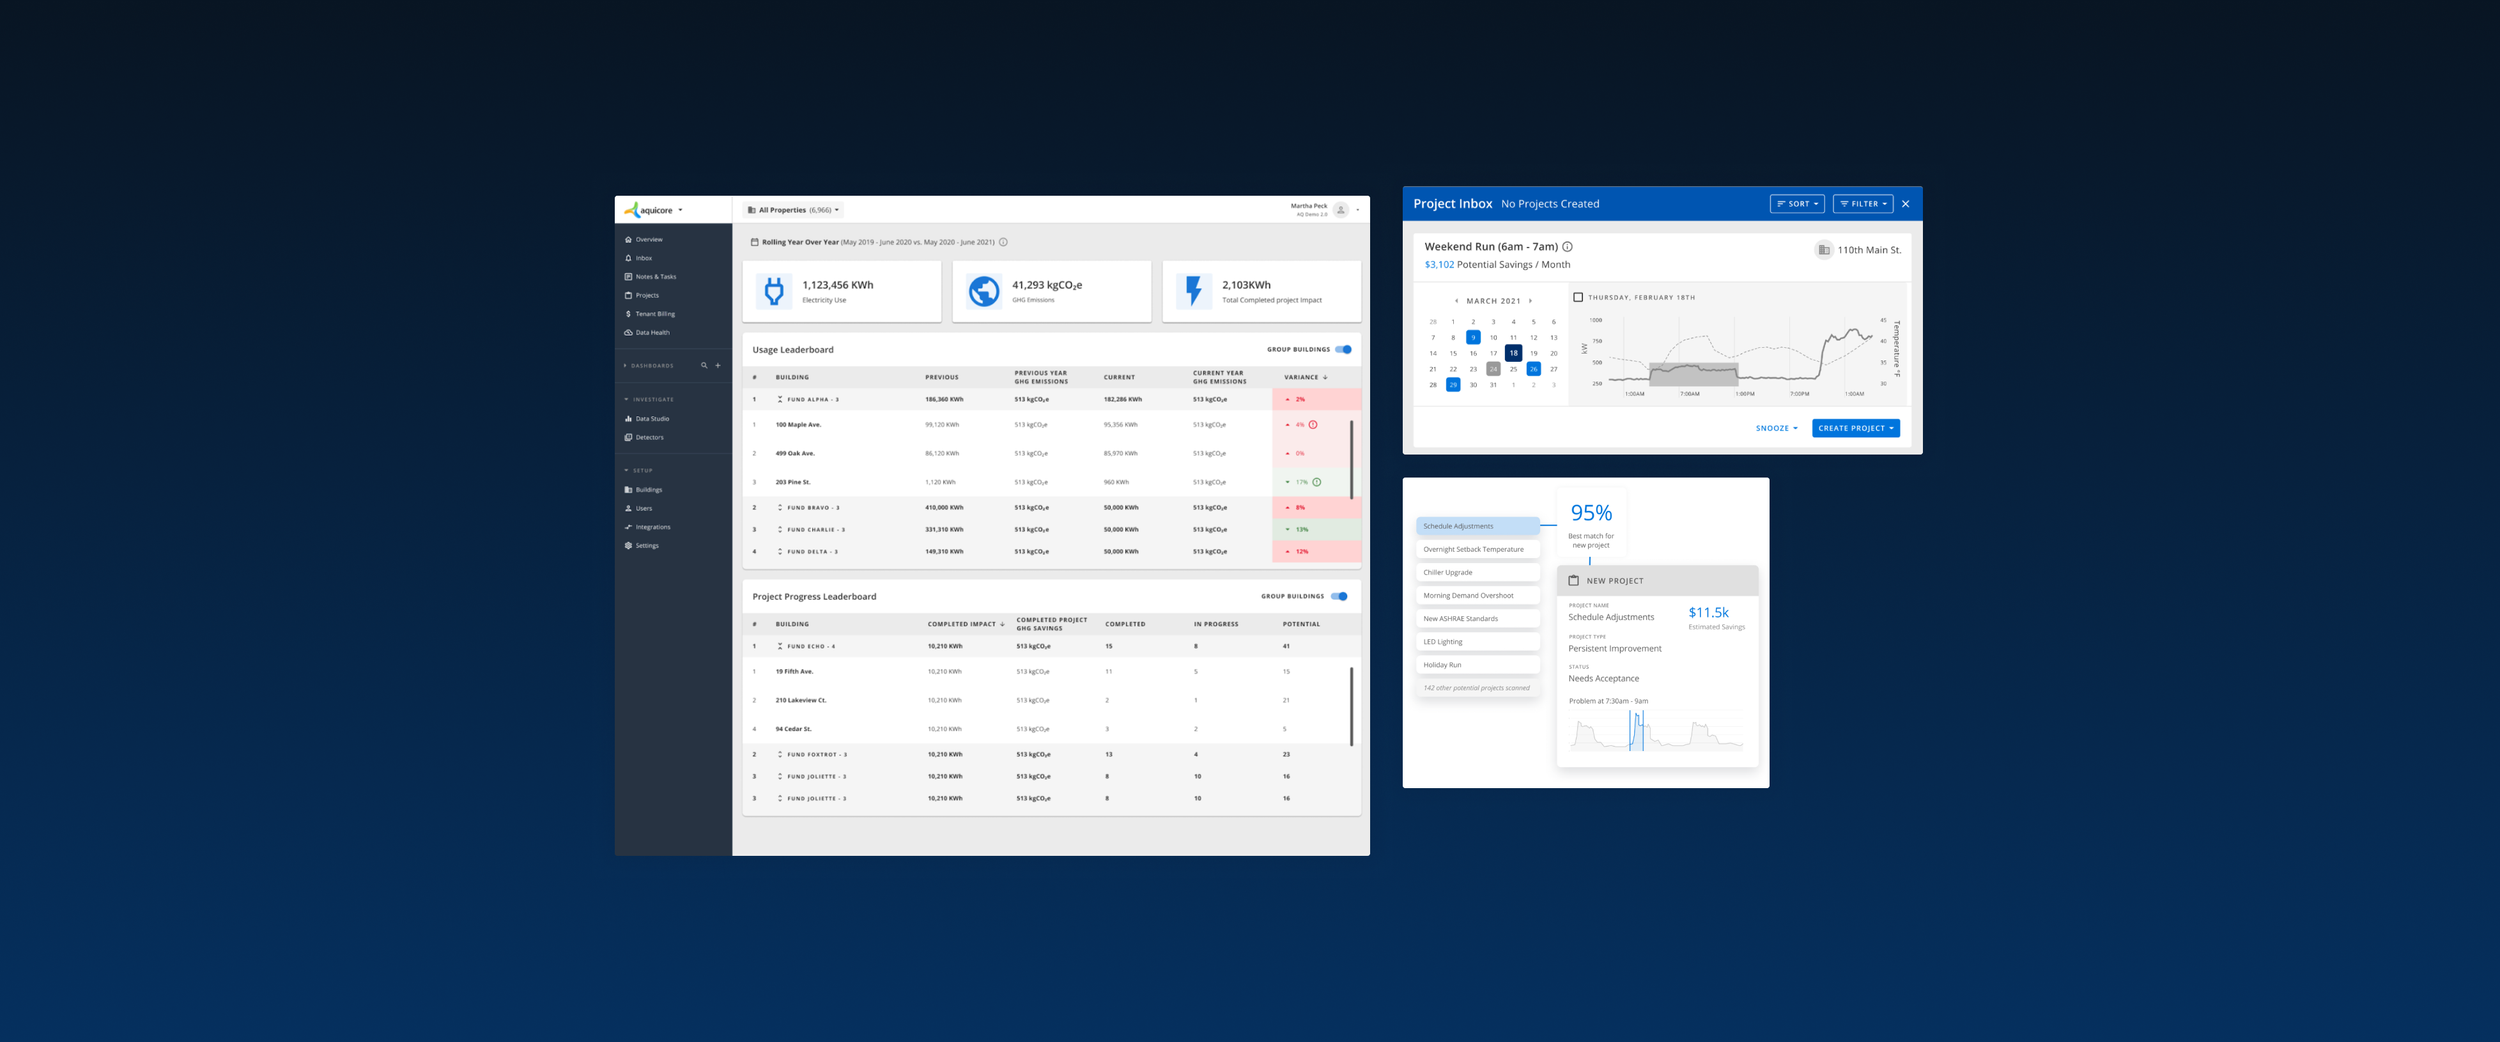
I created a final prototype that covered the solutions for every page of this project, creating a new detector visualization for issues in the building, along with ways for our customers to create and manipulate detectors so they work for their unique building needs. This used as many existing developed front end components as possible, while creating a couple new pieces that were imperative for the solution.
As trust of data was a key issue discussed with our customers, I allowed users to also view the information via “point trending”, which was a tool from a company that we had acquired which focused on collecting and displaying HVAC data in detail. It was a very old tool that was difficult to use, so users could see the issues at a high level here and select them to view in point trending, as to avoid having to scroll through mass amounts of data.

We created this page for users to manipulate the data for their building needs, as mentioned prior. They can choose different parameters that make sense for their buildings (maybe their building is in Florida, where the humidity is generally expected to be higher than, for example, Arizona). We filled in data based on what we had in our system for the structure of the building, while keeping settings clear and manageable for different scales of buildings.

Results + Next Steps
Results
We developed this solution and found success for our users managing their buildings issues at a whole. Rather than users needing to dig for variances in their data, we highlighted them and allowed users to act on them by creating projects. We found more projects were being created with more data to support their creation
Proposed next steps

Here’s a way we could highlight more bulk versions of the data issues, allowing users to see at an even higher level the issues automatically generated, and either confirm them or skip the issue.
What I Learned
While some projects have a lot of potential for some really large implications, users really need to trust and believe the data they see in order to support those larger steps. For this, we needed to support the data on percentage of issues so our users could ultimately automatically generate projects based on these parameters.
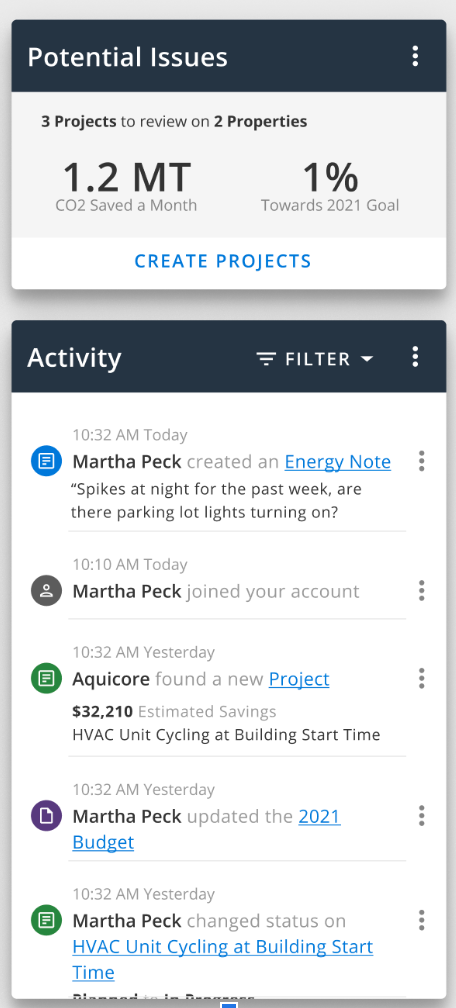
We could also potentially highlight these issues in an activity feed, so they would get the problems as they happen and be able to act upon them quickly