
Utility Anomaly Detection
Client
Aquicore
Timeline
2 months
My Role
Solo Product Designer
Team
Product Manager
User Researcher
Overview
By automating utility issue detection, we can reduce greenhouse gas emissions and cost for commercial real estate owners drastically.
Our app allowed users to see their overall utility usage, but without manually sifting through the data, problems could go un-identified for years. This could cost our users millions of dollars without them even knowing.


Uncovering the problems
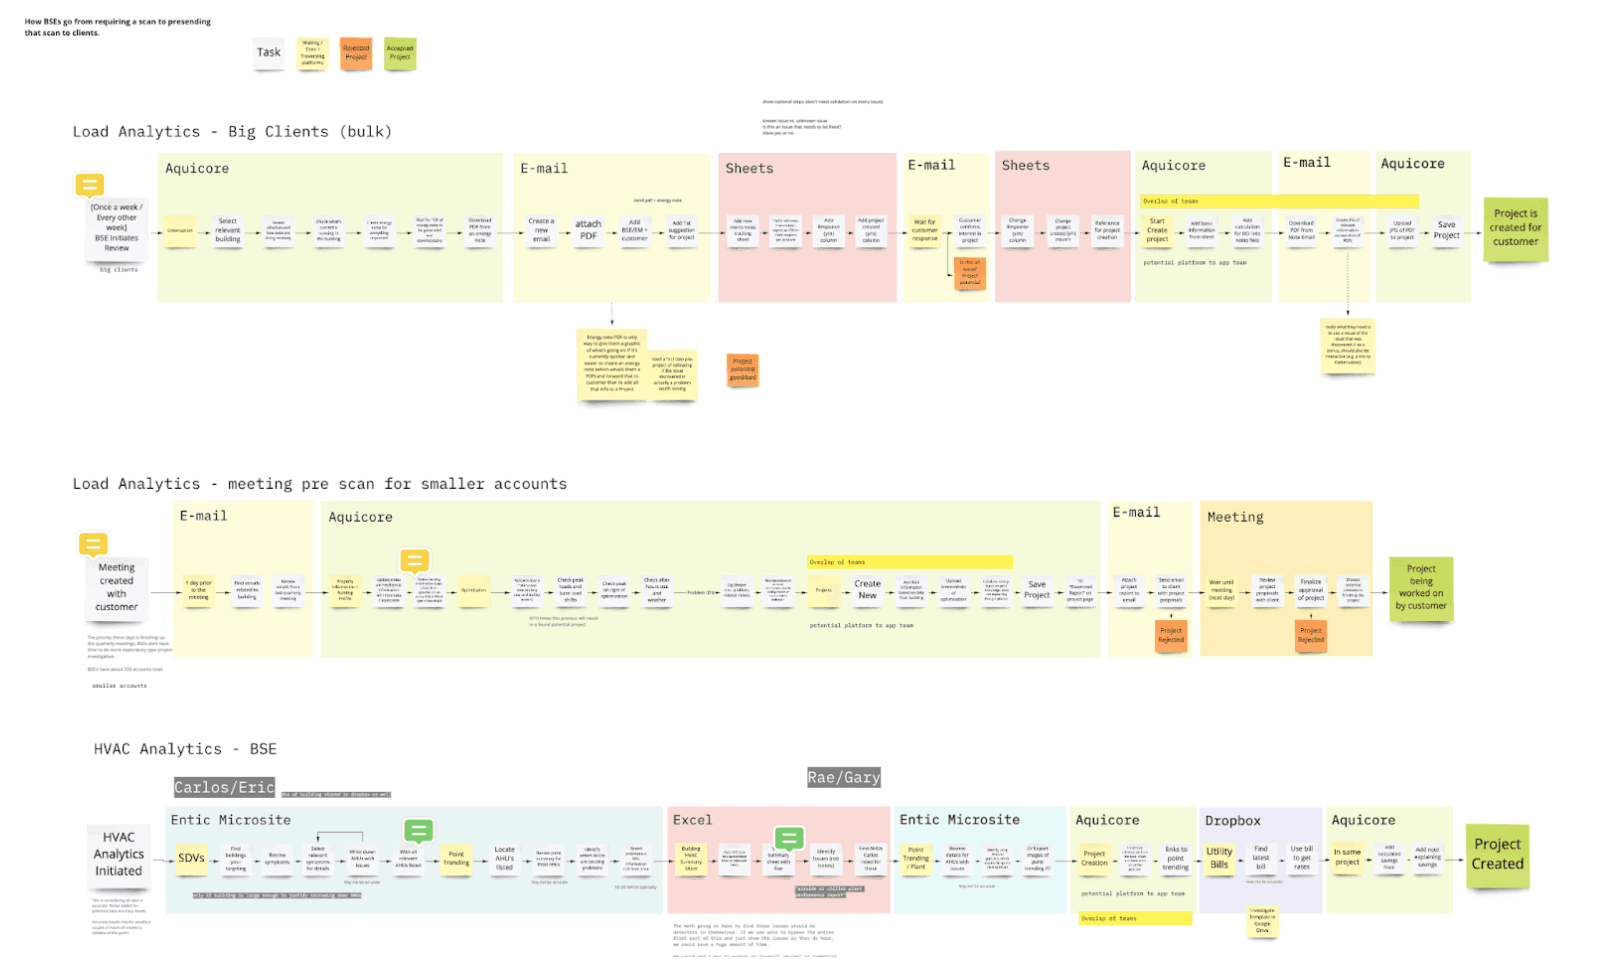
By interviewing 15 real estate managers and experts, I narrowed down what their current flow was to identifying issues and generating tickets to resolve them.
Meeting with our CEO, internal experts, and other stakeholders I gathered an understanding of what our internal needs are.

Competitve Analysis
Identifying how our competitors are solving this problem and understanding the positives/negatives for their experiences allowed me to understand how best to target the market.

Opportunity
After gathering all the information from users, our business needs/scope, and the competitive market, I created a potential user flow that became my north star while working through designs.

Keep users in the app
Our prior experience required users to jump from our app, to their utility manager, to their email, and back. By keeping users in the app and reducing steps that required them to jump, we can keep them focused on solving the problem rather than the logistical nightmare they used to experience.
Automate, automate, automate
By automating as many steps as possible, particularly around data, we can help users with the data they need rather than sifting throu a needle in the haystack.
Ideate & Test

Very early designs allowed me to explore high level visuals and ways to manage the data, and provided a tool for research.


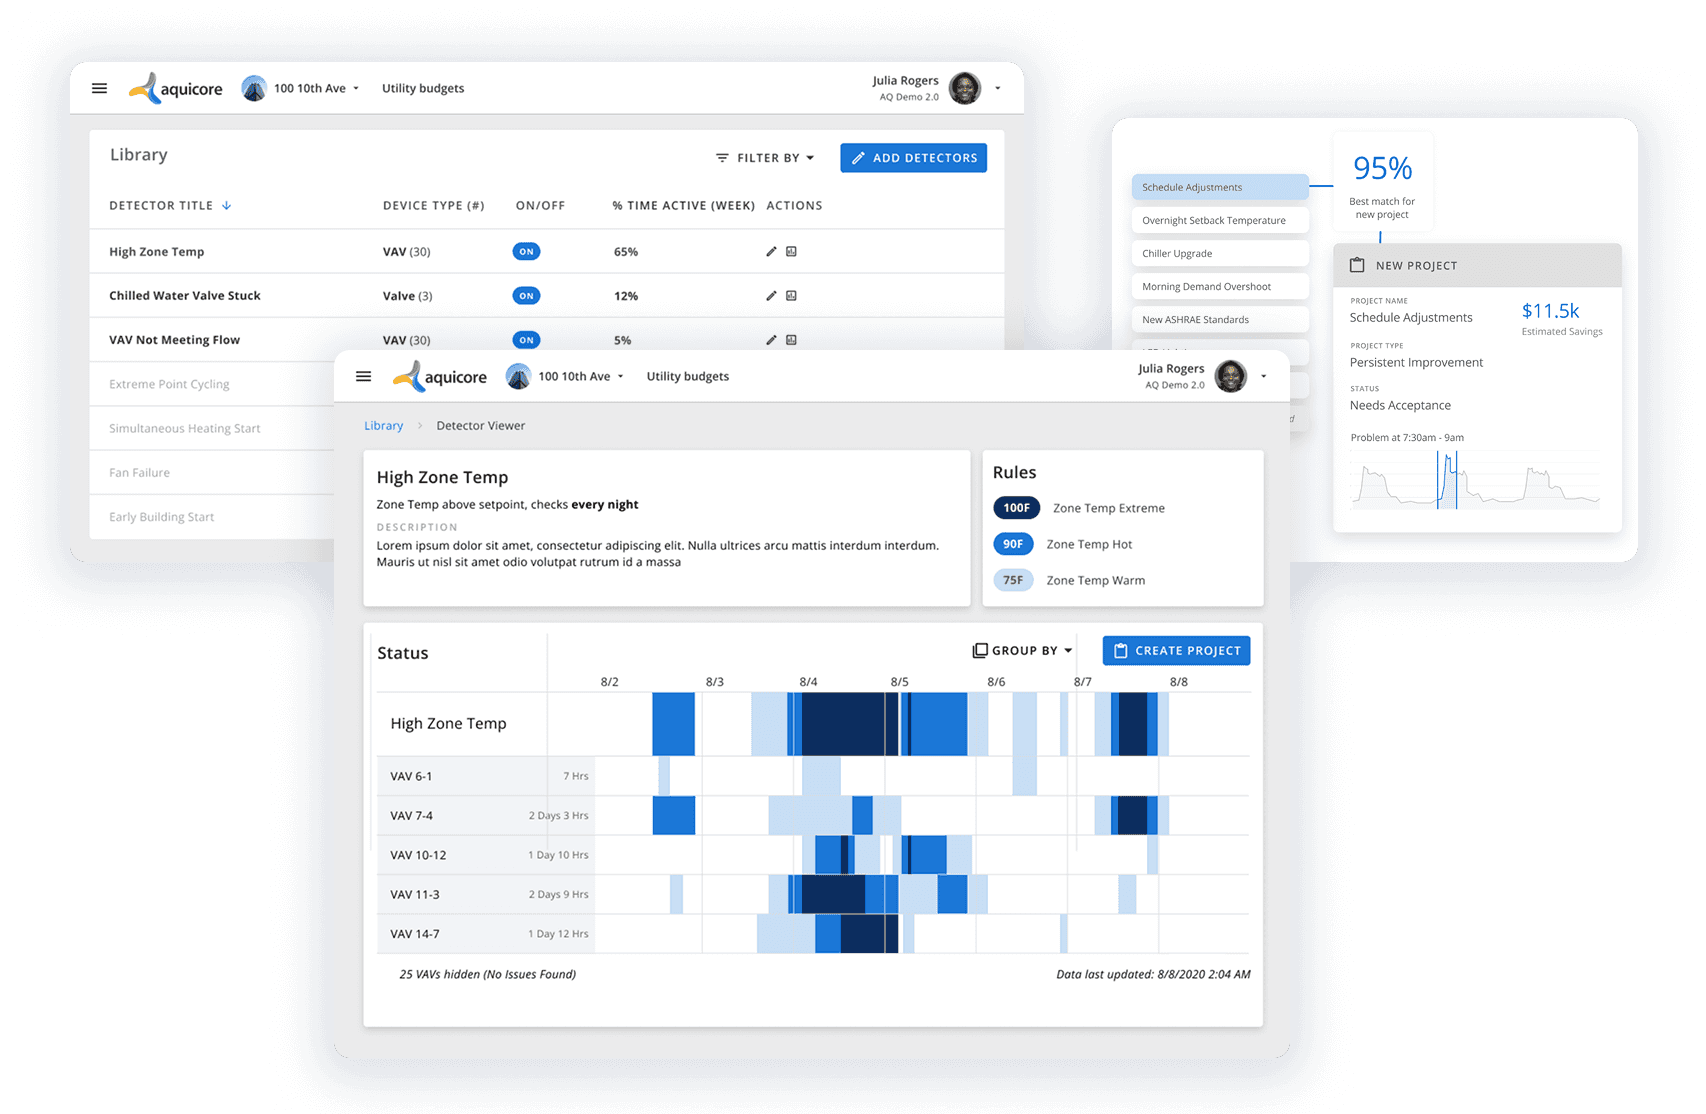
Design & Prototype


Outcomes
Utility reduction projects identified in first 24 hours
MoM change in projects created after release
Reducing the amount of hard data our users need to read over by generating key alerts and easy-to-review data visualizations made identifying projects significantly easier.
